
Table of Contents
WGS of single-HSPC colonies from chemo-treated patients
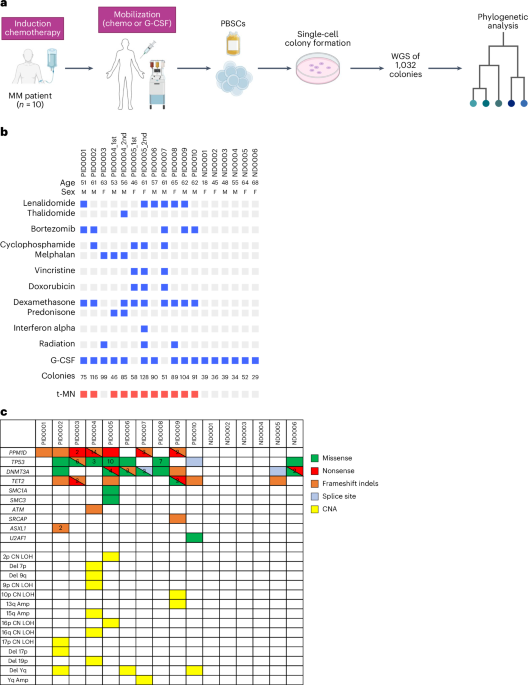
To study the impact of chemotherapy on the genome of hematopoietic stem and progenitor cells (HSPCs), we analyzed mobilized PBSCs collected from ten patients with multiple myeloma (MM) aged between 46 and 65 years (Fig. 1a). These patients were previously treated with various induction chemotherapies and underwent PBSC collection before autologous stem cell transplantation (ASCT). Two patients underwent ASCT twice with a different PBSC collection at an interval of 3 years and 15 years, respectively, and PBSCs collected from both timepoints were studied. To understand the clonal evolution from normal HSPCs to t-MNs, we enriched the cohort with patients who subsequently developed t-MNs. PBSCs from six normal donors (aged = 18–68 years) with no chemotherapy history were utilized as controls. Table 1 describes the detailed clinical characteristics of the ten patients. As PBSCs are collected before ASCT, cells are exposed to chemotherapies used for induction and mobilization (if chemotherapy is used), but not to the chemotherapies used for transplant conditioning because PBSCs are infused after completing conditioning chemotherapy (Extended Data Fig. 1a). For PBSCs collected at the second ASCT, chemotherapy exposure also includes maintenance or salvage therapies given after the first ASCT and mobilization therapy before the second PBSC collection, in addition to the exposure for the first ASCT (Extended Data Fig. 1b). Of note, in both scenarios, PBSCs are not exposed to high-dose conditioning chemotherapies. Therefore, prior therapy exposures for HSPCs included melphalan (n = 2), cyclophosphamide (n = 3), doxorubicin (n = 2), vincristine (n = 2), lenalidomide or thalidomide (n = 7), bortezomib (n = 5), radiation (n = 2) and interferon alpha (n = 1; Fig. 1b). This variation in the prior therapy allowed us to study the effect of both conventional cytotoxic chemotherapies (melphalan, cyclophosphamide, doxorubicin and vincristine) and noncytotoxic therapies (lenalidomide, thalidomide and bortezomib) on HSPC genomes.
a, Diagram illustrating the experimental workflow. b, Summarized PID and ND demographics, specific chemotherapeutic agents encountered by the analyzed HSPCs, the quantity of colonies evaluated and the occurrence of t-MN. Bright red boxes denote patients who developed t-MNs. c, Oncoplot of driver mutations and CNAs identified in at least one colony per patient and normal donor. The numeric value within each box represents the count of distinct mutations identified within the same gene. PID, patient ID; ND, normal donor. Panel a created with BioRender.com.
PBSC samples were cultured in semiliquid methylcellulose media to generate single-cell-derived colonies. Genomic DNA from these colonies underwent WGS. We sequenced a median of 89 colonies (range = 46–128) and 38 colonies (range = 29–52) per sample for treated patients and normal donors, respectively, totaling 1,276 colonies (1,047 colonies from treated patients and 229 colonies from normal donors). WGS achieved median 29× coverage (range = 14–68×; Supplementary Fig. 1a,b). Putative somatic mutations were identified in each colony after computationally filtering potential germline variants, sequencing artifacts and mutations that are likely acquired during in vitro culture, using bioinformatic approaches modified from previous studies5,11. We analyzed the variant allele frequency (VAF) distribution of somatic mutations in each colony to confirm their single-cell origin. Colonies lacking a 50% VAF peak or displaying multiple peaks were excluded as likely merged colonies (Supplementary Fig. 1c). Consequently, 1,261 colonies passed the quality control and were analyzed further.
Samples from treated patients had a median of 7 driver mutations (range = 0–19) and 1 copy number aberration (CNA; range = 0–5) per sample, whereas normal controls had medians of 0 driver mutations (0–3) and 0 CNAs (0–0; Fig. 1c). The most frequently identified driver genes in treated patients were PPM1D and TP53 (each in seven samples), followed by DNMT3A in six samples and TET2 in five. CNAs were rare; the only recurrent abnormality was Yq deletion in three samples. In normal controls, DNMT3A mutations were the most frequent drivers, found in two older individuals (aged = 64 and 68 years). The notable enrichment of PPM1D and TP53 mutations, both involved in the DDR, aligns with their high prevalence in therapy-related CH18, contrasting with the profiles in normal controls2.
Mutation burden and signatures in post-treatment HSPCs
Studies have shown that the mutation rate in normal HSPCs follows a linear trajectory over time, with each single HSPC acquiring approximately 16–25 single-nucleotide variants (SNVs) per year4,5. Consistent with this, our normal donors’ PBSCs also showed mutation rate at 17.2 per year (95% confidence interval (CI), 16.3–18.2; Fig. 2a,b). Using these data as a benchmark, we plotted the somatic SNV counts in chemotherapy-treated HSPCs (‘post-treatment HSPCs’; Fig. 2a). Despite chemotherapy exposure, post-treatment HSPCs in eight of ten patients showed somatic SNVs matching normal age-related rates. In contrast, three samples from two patients (one sampled twice) deviated substantially, with approximately twofold or higher increases in somatic SNVs (PID0003 and PID0004; Fig. 2a). A similar trend was also observed in indels and multiple nucleotide variants (Supplementary Fig. 2). Notably, both patients had been treated with melphalan-containing therapies.
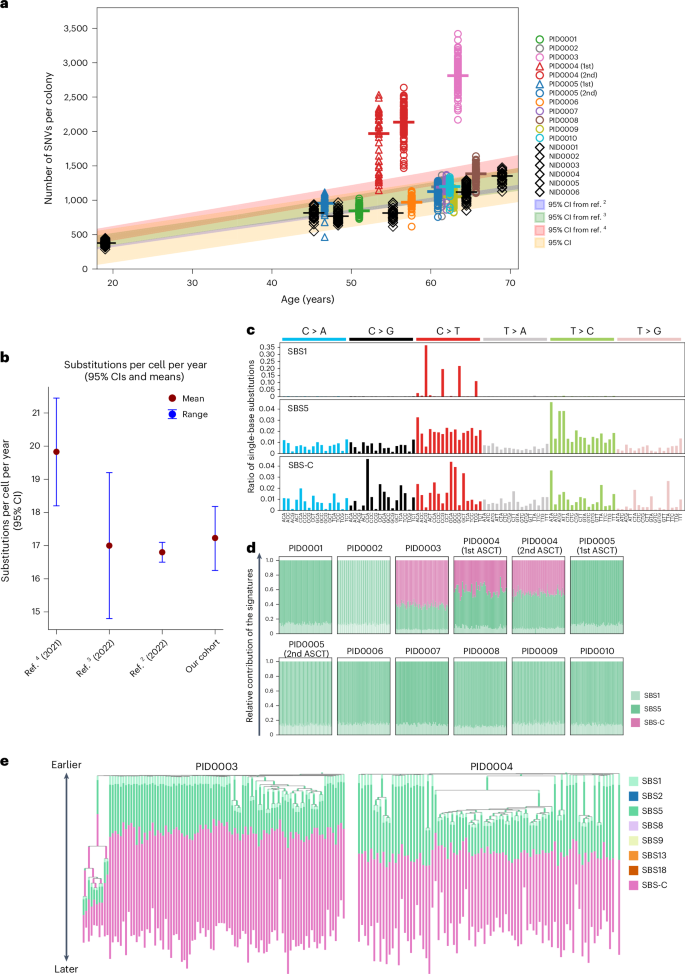
a, Scatter plot of somatic SNVs per colony against age, with the red line and area representing the normal mutation rate and 95% CI from six normal donor samples. b, 95% CI of normal mutation rates estimated from other studies and ours. c, Three distinct SNV signatures deduced from the sequencing of 1,032 colonies. SBS-C is closely related, with a 90% cosine similarity, to the SBS-MM1 signature22. d, A stacked bar chart illustrating the frequency distribution of SBS1, SBS5 and SBS-C signatures across all SNVs in individual colonies. e, Phylogenetic trees for PID0003 and PID0004, incorporating mutation signatures. SBS-C is apparent only in mutations acquired later in the patients’ lives.
To determine the causative relationship between melphalan treatment and the observed increase in somatic mutations, we extracted mutation signature from SNVs. In total, three mutation signatures were identified (Fig. 2c). Two were consistent with the known clock-like signatures, single-base substitution 1 (SBS1) and SBS5. SBS-C was exclusively found in the two patients exposed to melphalan. This signature showed cosine similarity of 90% with the previously identified signature SBS-MM1, which is a putative melphalan-associated signature detected in myeloma cells22 (Extended Data Fig. 2a). In PID0003 and PID0004, approximately 60% and 50% of mutations, respectively, were attributed to SBS-C, reflecting their elevated mutation burden compared to others (Fig. 2d). Both patients received melphalan as part of the melphalan + prednisone (MP) regimen. Notably, PID0003 had a longer treatment duration (9 months) than PID0004 (4 months), potentially contributing to the higher proportion of SBS-C mutations in PID0003’s HSPC genome. SBS-C was detected across all colonies at equal proportions, irrespective of driver mutations (Extended Data Fig. 2b), suggesting that melphalan affects HSPCs independently of their cell-cycle state, consistent with its known mechanism23. Phylogeny analysis shows SBS-C was acquired later in PID0003 and PID0004, reflecting post-treatment exposure at ages 53 and 52 years, respectively (Fig. 2e). These findings provide evidence of a causal link between melphalan exposure and elevated somatic mutational burden in these HSPCs. In the other patients, only clock-like signatures (SBS1 and SBS5) were observed24.
In contrast to melphalan, HSPCs exposed to cyclophosphamide (PID0002, PID0005 and PID0007), a similar alkylating agent, showed no increase in mutations or treatment-related signatures. This disparity likely reflects the HSC metabolism of cyclophosphamide into an inactive form via aldehyde dehydrogenase, thereby avoiding DNA damage, whereas melphalan directly forms DNA adducts in HSCs23,25,26. These findings underscore chemotherapy’s varied impact on the HSC genome and suggest that even agents within the same class can exert different effects on HSPC genomes in vivo.
Clonal architecture and diversity of post-treatment HSPCs
We reconstructed phylogenetic trees for post-treatment HSPCs and normal controls using shared and unique somatic SNVs from individual colonies. To avoid confounding clonal relationships and the molecular clock, we excluded treatment-related SBS-C mutations, using only clock-like signatures (SBS1 + SBS5; Fig. 3a,b and Extended Data Fig. 3). We then annotated the resulting phylogenies with known hematologic driver mutations or CNAs to clarify how expanded clades relate to these driver mutations.
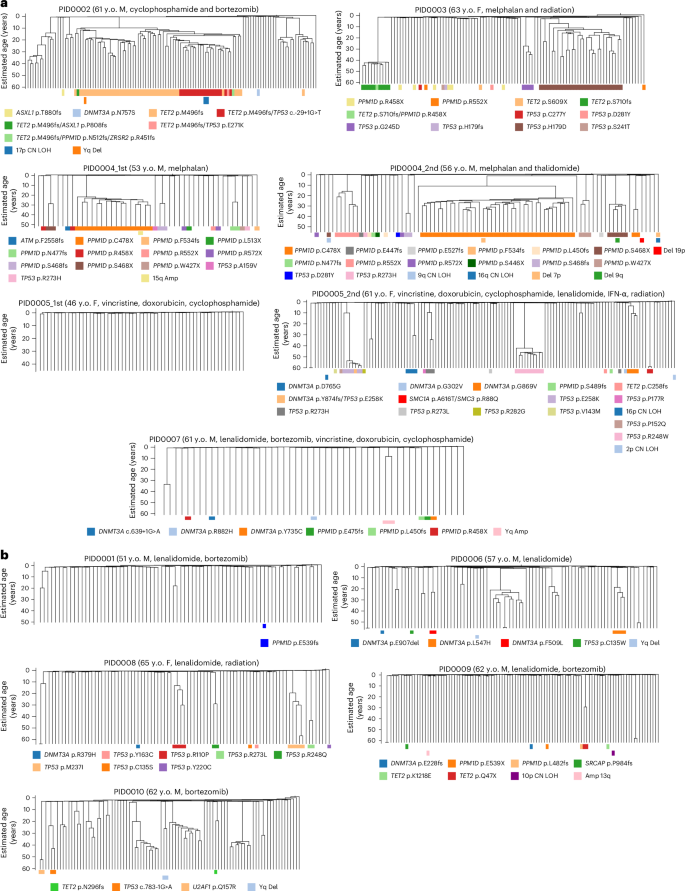
These trees are based on SNVs identified in individual colonies, excluding those associated with the SBS-C signature. The trees are further detailed at the bottom, indicating the presence of driver mutations (top row) and CNAs (bottom row). a, Trees corresponding to samples that underwent cytotoxic chemotherapy treatments. b, Trees for samples treated with noncytotoxic chemotherapeutic agents. y.o., years old.
The previous study showed that the clonal diversity of HSPCs decreases after the age of 70 years in normal individuals2. Some samples in the current post-treatment cohort displayed pronounced oligoclonality compared to age-matched controls, indicated by multiple large clades within the same patient (Fig. 3a,b and Extended Data Fig. 3). Quantitatively, the Simpson’s evenness index varied significantly among our patients’ samples and a subset of the samples showed a significantly lower evenness index that is comparable to that of normal individuals with age above 75 years, despite our cohort having patients aged 46–65 years (Fig. 4a,b). When we compared the evenness index between patients treated with conventional cytotoxic chemotherapies (melphalan, cyclophosphamide, doxorubicin and vincristine-treated samples) and noncytotoxic therapies (lenalidomide, thalidomide and bortezomib-treated samples), HSPCs exhibited lower evenness in patients treated with cytotoxic chemotherapies than in those receiving noncytotoxic therapies (Fig. 4c), suggesting a stronger population bottleneck of HSPCs under cytotoxic treatment.
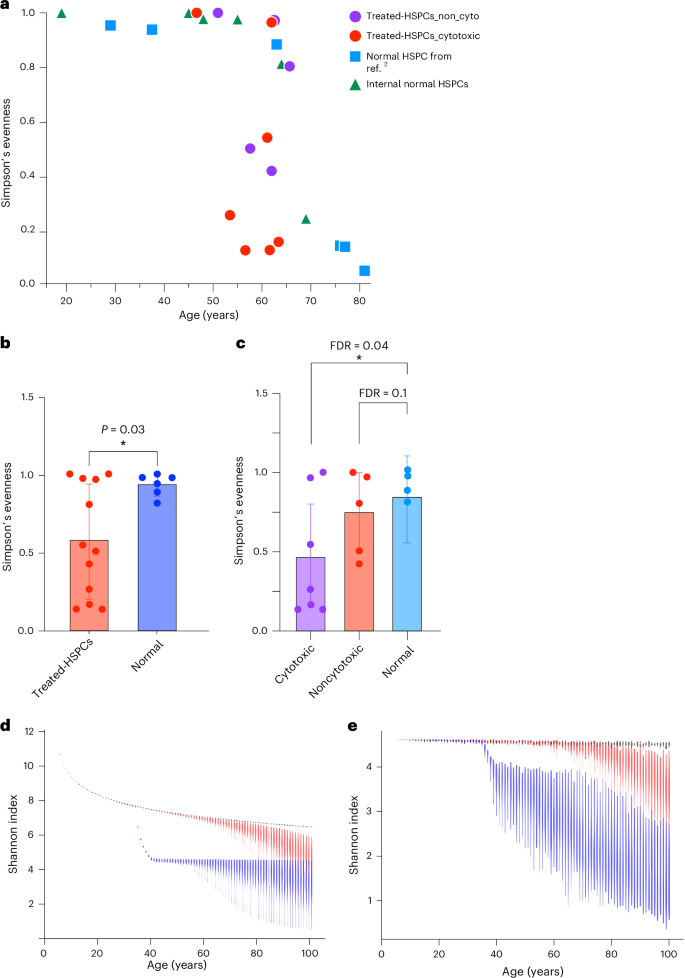
a, The Simpson’s evenness index of post-treatment HSPCs from our cohort compared to indices from internal normal control and normal individuals as reported in ref. 2. b, Comparison of the Simpson’s evenness index between post-treatment HSPCs (n = 12) versus age-matched normal HSPCs (n = 6, samples from ref. 2 and internal normal control combined). An unpaired two-sided t test was performed to assess statistical significance between normal donors and treated HSPCs. Data are presented as mean ± 95% CIs, *P < 0.05. c, Comparison of Simpson’s evenness index between HSPCs treated with cytotoxic chemotherapy (n = 7), noncytotoxic chemotherapy (n = 5) and age-matched normal control (n = 4). P value is obtained from unpaired one-sided t tests. Data are presented as mean ± 95% CIs. Asterisk indicates FDR < 0.05. d, The simulation illustrates the projected Shannon diversity index over time for a population of 100,000 HSPCs, modeled with the Moran model. Each violin plot at each timepoint represents the results of 100 independent simulations of the model. The black line represents scenarios where acquired mutations do not affect fitness; the red line includes some mutations conferring a selective advantage; the blue line indicates the introduction of chemotherapy at approximately ages 35–40 years. e, The simulation displays the Shannon diversity index over time, based on a random sampling of 100 HSPCs from a pool of 100,000, considering the emergence of chemotherapy-resistant mutations (for example, TP53 and PPM1D). FDR, false discovery rate.
To generalize our observation of the impact of chemotherapy on clonal diversity of HSPCs, we conducted stochastic simulation of HSPC dynamics based on the Moran model27. These simulations examined three scenarios—one where all acquired mutations were neutral, another with a mix of neutral and selectively advantageous driver mutations and a third including the effects of cytotoxic chemotherapy (Fig. 4d). Consistent with the prior study2, in the absence of chemotherapy, the natural occurrence of driver mutations contributed to a decline in diversity index around the seventh decade of life (Fig. 4d). The introduction of cytotoxic chemotherapy resulted in an immediate and sustained loss in clonal diversity (Fig. 4d). This pattern was also evident when examining the impact of sample size on the diversity index, particularly when 100 cells were randomly selected from the HSPC pool, which aligns with our experimental conditions (Supplementary Fig. 3). Furthermore, in scenarios where chemotherapy-resistant mutations emerge, such as TP53 and PPM1D mutations, the reduction in clonal diversity was exacerbated, with a broader range of variation observed (Fig. 4e). This aligns with our experimental observations (Fig. 4a). Collectively, these findings indicate that cytotoxic chemotherapy accelerates the loss of clonal diversity in HSPCs and its impact persists well beyond the treatment period.
Clone-specific analysis of mutation rate and telomeres
The majority of the expanded clades in post-treatment HSPCs carried driver mutations (30 of 57 clades (53%)), contrasting previous findings in normal individuals (10 of 57 (17%; ref. 2); Supplementary Fig. 4). Convergent evolution of DDR pathway mutations (TP53 and PPM1D) was pervasive among treated HSPCs. For instance, in PID0004, we detected six different clades evolving in parallel, each carrying different PPM1D mutations (Fig. 3a). This patient had a second timepoint sample taken 3 years after the first ASCT, which continued to show the convergent evolution of the same PPM1D mutations, indicating that all of these PPM1D-mutated clones engrafted after ASCT re-expanded and remobilized (Extended Data Fig. 4). Similarly, in PID0003, PID0005 and PID0008, we observed convergent evolution of multiple different TP53-mutated clones (Fig. 3a). These results are indicative of a strong selective pressure from chemotherapy in clonal selection of clones with DDR pathway genes.
In the context of myeloid malignancies, TP53 mutations frequently co-occur with complex chromosomal aberrations. However, in the post-treatment HSPCs examined in this study, 98% of TP53-mutated colonies (106 of 108 colonies) showed normal copy number profiles (Extended Data Fig. 5). Only two colonies exhibited concurrent chromosomal alterations, specifically a loss of heterozygosity (LOH) on chromosome 17p (PID0002; Fig. 3a and Extended Data Fig. 5), leading to biallelic alterations in TP53. These data suggest that TP53-mutated cells do not yet display genomic instability at the CH phase and the acquisition of chromosomal aberrations emerges as late-stage leukemogenic events.
To further assess the influence of driver mutations—particularly in DDR pathway genes—on genomic instability, we compared mutation rates in wild-type (WT) colonies and clades with or without driver mutations (Fig. 5a,c and Supplementary Fig. 5). Some TP53-mutant and PPM1D-mutant clades showed significantly higher mutation rates than WT colonies (Fig. 5c), although this was not universally observed across all clades with driver mutations. Additionally, certain clades without identified driver mutations also had increased mutation rates, likely due to accelerated proliferation rather than driver effects. Corroborating this hypothesis, some high-mutation clades demonstrated reduced telomere lengths (Fig. 5b,d). In addition, we observed inverse correlation between mutation rate (both overall and C > T changes at CpGs) and telomere length in HSPC colonies, further supporting the hypothesis that the increased mutation rate in some of the mutated cells is more likely attributed to accelerated clonal expansion rather than a direct result of the driver mutations per se (Fig. 5e and Supplementary Fig. 6). However, we acknowledge that these associations do not definitively establish causality, and it remains possible that increased mutation rates themselves may drive cell proliferation by acquiring mutations that confer selective advantages.
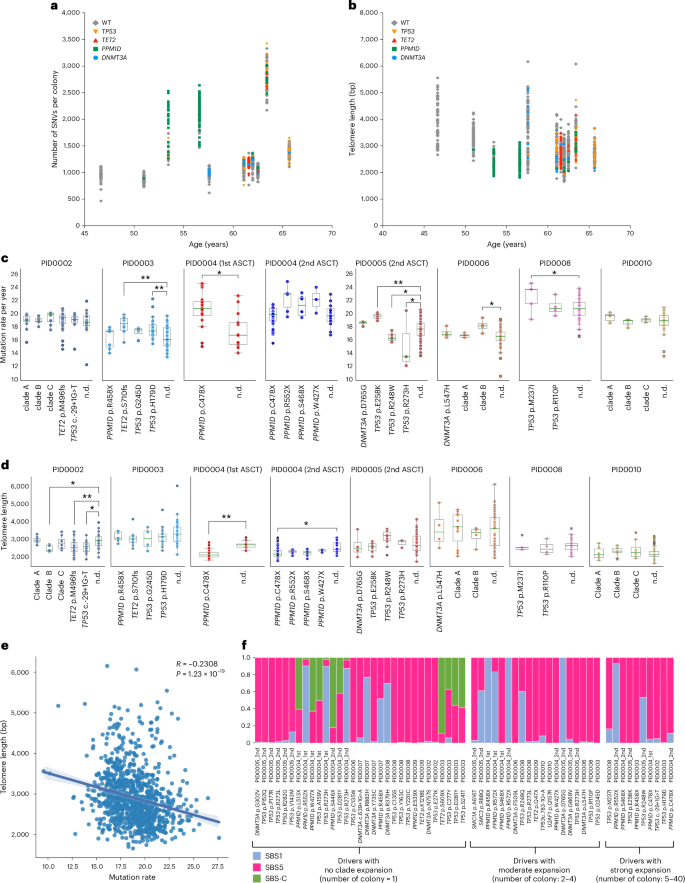
a, Distribution of SNVs across individual colonies plotted against age, with colonies categorized according to the presence of driver mutations. b, Distribution of telomere length across individual colonies plotted against age, with colonies categorized according to the presence of driver mutations. c, Comparison of mutation rate (SBS1 + SBS5 counts per year) between clades with or without driver mutations and WT colonies. Statistical significance was assessed using an unpaired t test. Single-asterisk indicates FDR < 0.05 and double-asterisk indicates FDR < 0.01. The definition of clades without driver mutations is described in Supplementary Fig. 5. Clades with fewer than three colonies are not shown. Box plots show the median (line), upper and lower quartiles (box) ±1.5× interquartile range (whiskers). d, Comparison of telomere length between clades with or without driver mutations and WT colonies. Statistical significance was assessed using unpaired t test. Single-asterisk indicates FDR < 0.05 and double-asterisk indicates FDR < 0.01. The definition of clades without driver mutations is described in Supplementary Fig. 5. Clades with fewer than three colonies are not shown. Box plots show the median (line), upper and lower quartiles (box) ±1.5× interquartile range (whiskers). For both c and d, PID0002—clade A (n = 12), clade B (n = 7), clade C (n = 8), TET2 p.M496fs (n = 67), TP53 c.-29 + 1G > T (n = 19), n.d. (n = 20); PID0003—PPM1D p.R458X (n = 7), TET2 p.S710fs (n = 10), TP53 p.G245D (n = 4), TP53 p.H179D (n = 28), n.d. (n = 43); PID0004 (first ASCT)—PPM1D p.C478X (n = 16), n.d. (n = 13); PID0004 (second ASCT)—PPM1D p.C478X (n = 40), PPM1D p.R552X (n = 6), PPM1D p.S468X (n = 6), PPM1D p.W427X (n = 3), n.d. (n = 16); PID0005 (second ASCT)—DNMT3A p.D765G (n = 4), TP53 p.E258K (n = 6), TP53 p.R248W (n = 10), TP53 p.R273H (n = 3), n.d. (n = 86); PID0006—DNMT3A p.L547H (n = 4), clade A (n = 11), clade B (n = 4), n.d. (n = 67); PID0008—TP53 p.M237I (n = 5), TP53 p.R110P (n = 4), n.d. (n = 72); PID0010—clade A (n = 10), clade B (n = 12), clade C (n = 8), n.d. (n = 55). e, Scatter plot correlating mutation rate (SBS1 + SBS5 counts per year) and telomere length in each colony. Spearman correlation analysis was performed to assess the relationship between these variables. The shaded region around the regression line indicates the 95% CI for the regression estimate. f Assessment of the contribution of specific mutation signatures on individual driver mutations detected in treated colonies. Mutations are segregated based on the clade expansion. All SBS-C-related mutations were found in colonies with no clade expansion. n.d., colonies with no driver mutations.
To further validate these findings that TP53 mutations or PPM1D mutations themselves are not the cause of increased mutation rate in HSPCs, we studied clone-specific mutation burden analysis using genetically engineered mouse model of therapy-related CH. Specifically, we conducted a chimeric bone marrow transplantation of WT (CD45.1) and Trp53−/− mice (CD45.2) or WT and Ppm1dmut/+ mice (CD45.2) with 1:9 ratio. After engraftment, recipient mice were treated with either vehicle or cisplatin, and bone marrow cells were collected to generate single-HSPC colonies (Extended Data Fig. 6a). Each colony was genotyped and analyzed by WGS for clone-specific mutation rates and mutational signatures. Consistent with our human data, both Trp53−/− and Ppm1dmut/+ cells showed mutation rates comparable to WT cells (Extended Data Fig. 6b,d). Cisplatin treatment increased mutation rates, with known platinum signatures (SBS31 and SBS35), but this increase occurred equally in both mutant and WT cells (Extended Data Fig. 6b–e). Furthermore, CNAs did not differ between mutant and WT cells, with or without cisplatin (Extended Data Fig. 6f). These findings align with our human data, indicating that at the CH stage, TP53-mutated and PPM1D-mutated cells do not inherently exhibit increased genomic instability compared to WT cells.
Next, given the evidence of chemotherapy-induced somatic mutations in HSPCs, particularly from melphalan, we investigated chemotherapy’s direct role in generating driver mutations. Using established methods, we mapped each mutation’s nucleotide context to specific signatures to estimate their contribution (Fig. 5f)28. Predominantly, the driver mutations corresponded with signatures SBS1 or SBS5. However, the TET2 p.S609X mutation in PID0003 and the PPM1D p.S446X mutation in PID0004, identified at the second timepoint, had an 89% and 82% probability of contribution from SBS-C, respectively. Furthermore, additional driver mutations—including two TP53 mutations in PID0003 and one PPM1D plus one TP53 mutation in PID0004, detected at the first timepoint—exhibited over a 50% likelihood of association with SBS-C. Notably, the mutations linked to SBS-C did not demonstrate clonal expansion in our phylogenetic analysis (Figs. 3 and 5f). Although assigning specific mutations to chemotherapeutic agents via mutational signatures has limitations, these findings suggest that melphalan may induce some driver mutations in HSPCs, but they likely confer limited selective advantages, possibly due to their later-life induction, which limits clonal expansion.
Mapping the clonal origin of t-MNs in PBSC samples
In the current cohort, nine of ten patients developed t-MNs with a median of 3 years (range = 1–8 years) following PBSC collection. We obtained bulk DNA from bone marrow samples at t-MN diagnosis and conducted bulk WGS (median 52× coverage). The mutational profiles and chromosomal abnormalities found in t-MN samples are detailed in Table 2.
To understand the clonal origin and evolutionary history of t-MN development, we integrated HSPC colonies and t-MN genomes for phylogenetic analysis. This approach identified the most recent common ancestor (MRCA) of t-MNs in 5 of 9 (56%) patients’ PBSC samples (PID0002, PID0005, PID0006, PID0008 and PID0010; Fig. 6 and Supplementary Fig. 7) via shared variants between colonies and t-MN genomes.
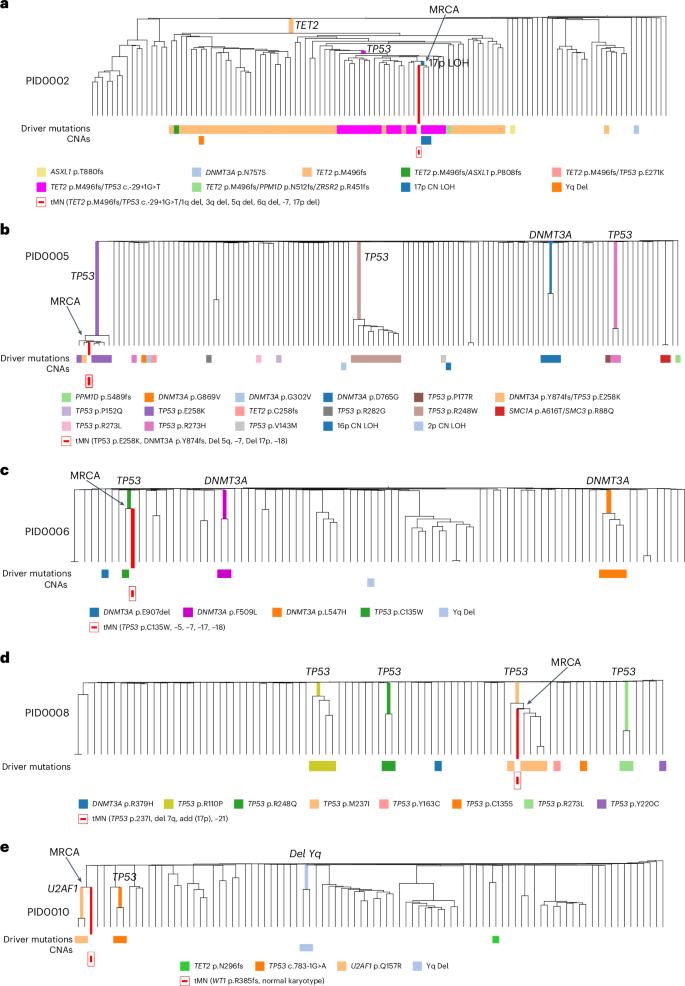
a, Integrated phylogenetic tree for PID0002 highlighting the MRCA pinpointed to a clone with concurrent TET2, TP53 mutations and 17p LOH. b, Integrated phylogenetic tree for PID0005 where MRCA was identified in TP53 and DNMT3A-mutated clone. c, Integrated phylogenetic tree for PID0006 where the MRCA is identified within a clone possessing a TP53 mutation. d, Integrated phylogenetic tree for PID0008 with the MRCA traced to a TP53-mutated clone. e, Integrated phylogenetic tree for PID0010 showing the MRCA located at a branching point preceding the acquisition of a U2AF1 mutation.
PID0002 developed therapy-related myelodysplastic syndrome (t-MDS) 1 year post-ASCT. Analysis of this patient’s HSPC colonies revealed a prominent clone with a TET2 mutation, containing subclones with an additional TP53 mutation. Within these subclones, two colonies also possessed 17p LOH, indicative of biallelic TP53 alterations. The MRCA of the t-MDS clone was traced to the branchpoint of these specific clones, which carried mutations in TET2, TP53 and 17p LOH (Fig. 6a and Supplementary Fig. 7a). The t-MDS sample also presented with additional CNAs such as monosomy 5 and 7, which were absent in the HSPC colonies, indicating subsequent acquisition post-MRCA.
PID0005 underwent two PBSC collections, occurring 20 and 6 years before the development of t-MDS, respectively. PBSC colonies at the first timepoint showed polyclonal HSPCs without any CH mutations. However, the second timepoint samples exhibited multiple parallel clones with TP53 mutations and DNMT3A mutations. Notably, one clone with the TP53 p.E258K mutation underwent significant expansion and included single colony with an additional DNMT3A p.Y874fs mutation. We traced MRCA of the t-MDS clone adjacent to the colony with this double TP53 and DNMT3A mutations (Fig. 6b and Supplementary Fig. 7b). Bulk sequencing of the t-MDS sample identified both mutations with additional CNAs involving chromosomes −5, −7, −17p and −18.
PID0006’s t-MDS emerged 8 years after PBSC collection. This patient’s HSPC colonies comprised three distinct clones with different DNMT3A mutations and one colony with a TP53 p.C135W mutation without any CNAs. The t-MDS sample harbored the same TP53 mutation but also monosomy 17, indicating biallelic TP53 alteration. Phylogenetic integration pinpointed the MRCA of the t-MDS clone with the colony harboring the TP53 mutation (Fig. 6c and Supplementary Fig. 7c).
PID0008 presented with t-MDS 6 years postcollection. Multiple parallel TP53-mutated clones were identified in HSPC colonies without any concurrent CNAs. Among them, the TP53 p.M237I mutation was also found in the t-MDS sample. The MRCA was located within the clones carrying this TP53 mutation (Fig. 6d and Supplementary Fig. 7d). Additionally, the t-MDS sample had an essential splice site TP53 mutation not detected in the colonies, indicating that the second TP53 mutation was acquired post-MRCA. The shared feature of these four cases is that the sequential acquisition of secondary mutations and biallelic alteration of TP53 is the critical factor determining malignant transformation.
The fifth case, PID0010, developed t-MDS 3 years after PBSC collection. The patient’s HSPC colonies included two with U2AF1 mutation and two with TP53 mutations, none of which appeared in the t-MDS sample. However, phylogenetic analysis traced the MRCA of t-MDS to a branchpoint preceding the U2AF1 mutation, indicating the clone that led to t-MDS had diverged before acquiring U2AF1 mutation (Fig. 6e and Supplementary Fig. 7e). Instead, the t-MDS sample contained a WT1 mutation.
In the other four cases (PID0001, PID0004, PID0007 and PID0009), phylogenetic analysis did not identify an MRCA in the studied colonies (Extended Data Fig. 7 and Supplementary Fig. 8). These t-MN clones diverged early and shared few mutations with HSPC colonies, an unexpected finding given that some colonies carried high-risk CH mutations (TP53, PPM1D). Given the limited number of analyzed colonies (~100 per patient), these results may reflect sampling bias. Alternatively, t-MNs may arise from nonmobilized bone marrow HSPCs. We examined t-MN mutation signatures under the hypothesis that residual HSPCs would show a melphalan-induced footprint from conditioning regimen. Indeed, approximately 40% of PID0007’s and PID0009’s t-MN mutations were SBS-C, indicative of melphalan exposure (Extended Data Fig. 8). Given that PID0007 and PID0009 did not receive melphalan during the induction phase, it suggests that the t-MN originated from bone marrow HSPCs that were subjected to high-dose melphalan during the conditioning regimen. Although these findings require validation in a larger cohort, they suggest the following two distinct developmental pathways for t-MNs post-ASCT: while most arise from clones within PBSCs, a minority may develop from nonmobilized bone marrow HSPCs that underwent conditioning therapy (Extended Data Fig. 9).
