Effects of preanalytical sample processing on urine chemokines assessment
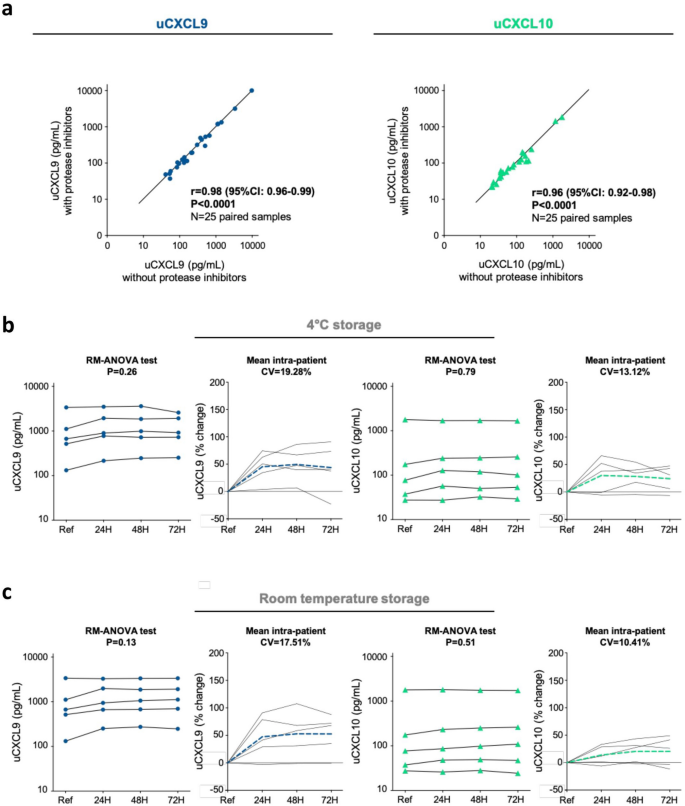
If urinary chemokines are to be used for routine surveillance of KTRs, urine sample collection and processing have to be optimized to fit hospital’s constraints (Fig. 1, Sample collection & storage). In research, protease inhibitors (PI) are usually added after urine supernatant collection to prevent protein degradation upon long-term storage. However, this additional step during sample preparation is time consuming, costly, and might prevent consistent practice between centers. Thus, valid information about necessity of PI addition to prevent CXCL9 and CXCL10 degradation is essential. Chemokine levels of 25 urine samples were compared according to the addition or not of PI during sample preparation. Median time from sample collection to quantification was 147 days [IQR: 127–184]. Figure 2a shows a nearly perfect correlation for CXCL9 (Spearman r = 0.98 [95% CI 0.96–0.99], P < 0.0001), with a mean with/without PI ratio = 1, as well as for CXCL10 (Spearman r = 0.96 [95% CI 0.92–0.98], P < 0.0001), with a mean with/without PI ratio = 1.1.
Overview on clinical workflow steps and research validation studies performed to assess Ella® quantification of urine chemokines: bringing research innovation to daily care. Left panel illustrates the 4-step workflow if urine chemokine were used in daily practice: sample collection and storage, assay preparation, chemokines quantification and acute rejection risk assessment. For each clinical step, the middle panel shows the corresponding validation studies which were conducted, independently from manufacturer’s certification. The right panel presents the web application (https://wise-master.admin.semeia.io/bioptim_computation) that was developed to prompt the use of urine chemokines in daily practice. A screen shot of the user interface is shown, illustrating how clinical and biological data can easily be filled in. Abbreviations: AUC, area under the curve; CV, coefficient of variation; LOQ, limit of quantification; min, minutes; prep, preparation; PI, protease inhibitors; RT, room temperature.


Effects of preanalytical sample processing on urine chemokine assessment. (a) Sample preparation study. Correlation plots illustrating relationships between uCXCL9 (left panel) and uCXCL10 (right panel) measurement from 25 pairs of urine samples, prepared and stored with or without protease inhibitors. P-value and r from a Spearman correlation test. (b, c). Sample storage study. Changes in urinary chemokine concentration over various processing delay (24H, 48H and 72H) and at 4 °C (Panel b) or room temperature (Panel c) storage conditions. Raw data from 5 individual samples are presented as solid lines for CXCL9 (navy blue dots) and for CXCL10 (green triangles). The percentage change was calculated at each timepoint in comparison to reference sample, and mean percentage change at each timepoint is presented by dashed lines (navy blue for CXCL9 and green for CXCL10). RM-ANOVA was performed to assess intra-patient variability. CV was calculated between all 4 urinary chemokine levels and mean CV is given as the mean of all intra-patient CVs. Baseline refers to standard sample processing (within 3H after collection) and storage (freezing at − 80 °C).
Effects of processing delay and storage conditions on urine chemokines assessment
If routinely implemented, urine chemokine assessment might not be available in each single hospital and shipment to a centralized reference center might be considered. Besides, freezing a urine specimen prior to centrifugation may cause cell lysis upon thawing, allowing cellular cytoplasmic protein to contaminate the urine specimen. In research, an early centrifugation step is thus usually performed to pellet cells, but it requires an available technician and a dedicated equipment. Thus, we investigated the influence of time and storage conditions on chemokine quantification. Fresh urine samples from 5 patients were kept at 4 °C or RT for respectively 24, 48 or 72 h. Centrifugation to pellet urine cells and collect urine supernatant was performed immediately before − 80 °C storage.
Within-person stability assessment showed similar results of CXCL9 and CXCL10 levels over time for samples kept at 4 °C (P = 0.26 and P = 0.79, Fig. 2b) or at RT (P = 0.13 and P = 0.51, (Fig. 2c). Up to 72 h at RT, mean intra-patient CV did not exceed 20% for CXCL9 (4 °C, CV = 19.28%; RT, CV = 17.51%) and 15% for CXCL10 (4 °C, CV = 13.12%; RT, CV = 10.41%). Percent change in chemokine level was consistently positive across conditions, indicating a minor increase in chemokine levels upon time. Main variation happened within the first 24 h, suggesting cell lysis from urine cell pellet with adds-on from intracellular chemokines.
Effects of repeated freeze–thaw cycles on urine chemokines assessment
Next, we investigated the influence of repeated freeze–thaw cycles on both chemokines quantified in 5 urine samples (Table 1). In comparison to samples thawed only once (T1), up to 4 additional cycles (T2–T5) did not significantly change within-patient levels of CXCL9 (P = 0.79) and CXCL10 (P = 0.26). The percentage change and CV in CXCL9 and CXCL10 concentration were calculated for each refrozen sample in comparison to the baseline T1 sample. With mean CV of 10.63% for CXCL9 and 18.90% for CXCL10, both assays were found to meet the FDA acceptance criteria for bioanalytical method validation (< 20%, https://www.fda.gov/files/drugs/published/Bioanalytical-Method-Validation-Guidance-for-Industry.pdf). Percent change remained low for both chemokines and was consistently negative for CXCL10, suggesting a more fragile protein, with possible degradation over repeated freeze-thaw cycles.
Linearity and range of measurement
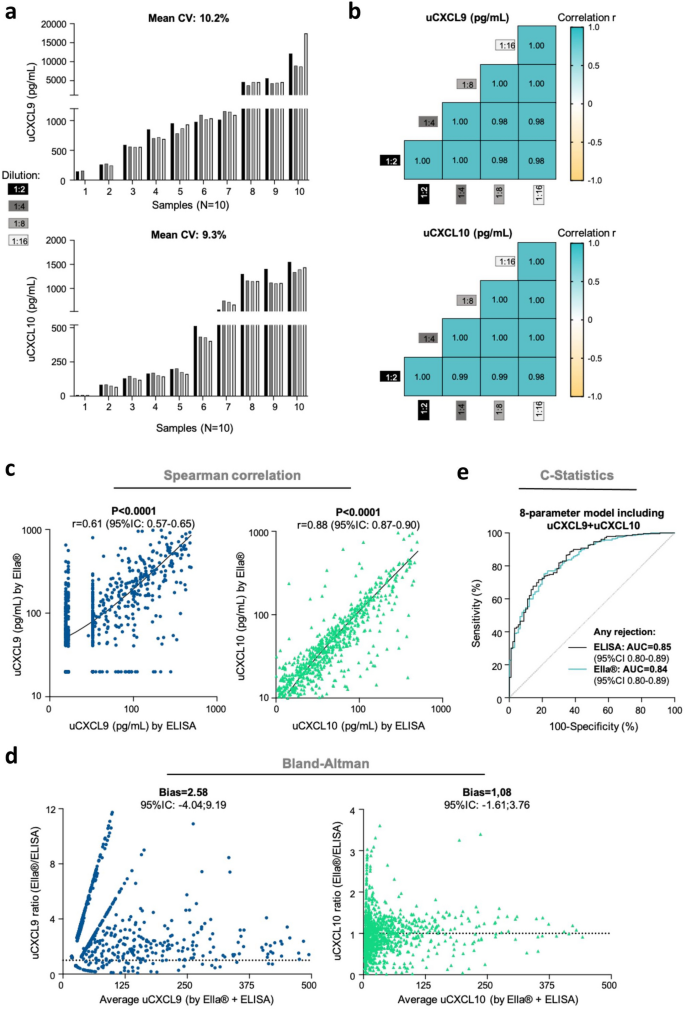
CXCL9 and CXCL10 Ella® cartridges have not been validated on human urine samples. Considering the wide range of pH and urine specific gravity, and that urine complex matrix may hinder immunologic testing, we run an in-house validation of all aspects of analytical performance of the assay (Fig. 1, Chemokines quantification). Ella® cartridges are provided with an internal calibration curve, i.e. a relationship between fluorescence and known concentrations of the analyte. But a calibration curve should be prepared in the same biological matrix as the sample. First, we investigated the ability of the assay to produce results that are directly proportional to the concentration of analyte in the urine sample. Linearity was assessed from 10 samples with a broad range of chemokine values from previous measurement, subjected to serial dilution (1:2, 1:4, 1:8 and 1:16). A high repeatability for each sample was assessed with mean intra-patient CV of 10.2% for CXCL9 and 9.3% for CXCL10 (Fig. 3a). From a Spearman correlation analysis between each dilution factor, all r values were ≥ 0.98 (Fig. 3b). For CXCL10, linearity was confirmed within the complete range given by the manufacturer (dilution-corrected range 1.2–1840 pg/mL). For CXCL9 (manufacturer’s range: 39.8–60,800 pg/mL), linearity was found reliable between 100 and 10,000 pg/mL, but was less clear for extreme values. Hence for sample 10 (Fig. 3a), CXCL9 deviated from 8732 pg/mL (1:8 dilution) to 17464 pg/mL (1:16 dilution, CV = 47.1%, %change = 100). To further define CXCL9 lower and upper limits of quantification (LLOQ-ULOQ) on urine, we used recombinant CXCL9 serially diluted (1:2) into Sample Diluent or into pooled urine from healthy kidney donors, all with undetectable CXCL9 levels (Supplementary Table 1). Recovery at 11 different spiked concentrations (N = 3) showed less reliable CXCL9 assessment below (expected value) 31.3 pg/mL and above 2000 pg/mL (Table 2). Overall, our linearity and recovery data support the following LLOQ and ULOQ on urine sample: 39.8–2000 pg/mL (CXCL9) and 0.6–920 pg/mL (CXCL10).


In-house validation of Ella® assay performance for chemokine quantification from a urine sample. (a, b). Linearity study. (a) Histograms showing uCXCL9 (upper) and uCXCL10 (lower) levels from 10 KTRs urine samples, serially diluted (1:2, 1:4, 1:8 and 1:16) before quantification. For each patient, CV was calculated between each diluted sample and the reference sample (1:2 dilution), and mean CV is given as the mean of all intra-patient CVs. (b) Correlogram illustrating correlation between uCXCL9 (upper) and uCXCL10 (lower) levels after serial dilution for the same 10 KTRs. R values from a Spearman correlation, all P-values < 0.0001. (c, d) ELISA to Ella® correlation study. (c) Correlations between uCXCL9 (N = 1048, navy blue dots) and uCXCL10 (N = 1048, green triangles) levels when measured by ELISA (x-axis) or by Ella® (y-axis) methods. R values from a Spearman correlation, all P-values < 0.0001. (d) Bland-Altman analysis. For each chemokine, Ella®/ELISA ratio (y-axis) is plotting against average chemokine levels (x-axis). Ella®/ELISA ratio of 1 would indicate perfectly superimposable values resulting from both techniques. Bias refers to deviation from this ideal ratio. For representation purpose, only average values < 500 pg/mL are shown. (e) Diagnostic accuracy (C-statistics) of Ella® results tested against reference ELISA results. ROC curves illustrating the diagnostic performance of the 8-parameter chemokine model for any acute rejection, when trained on Ella® or ELISA results (N = 976 samples with no missing value).
Within- and between-run precision
For both assays, precision was assessed on 5 urine samples quantified twice on the same cartridge (intra-assay precision), or quantified twice by different technicians on different days (inter-assay precision). The intra‐assay and inter-assay CVs were 4.7% and 15.3%, respectively for CXCL9, and 2.6% and 16.6%, respectively for CXCL10 (Table 3). For CXCL9, intermediate precision was further refined in a larger number of samples (N = 32) to assess technician-to-technician and day-to-day variations in high, mid and low CXCL9 concentration samples. Under the same set of conditions and within a short interval of time, repeatability ranged from 3.8% (mid CXCL9) to 11.6% (low CXCL9). When investigating the random error introduced by factors like specific technicians, between-run variation was also acceptable with CV ranging from 9.6% (low CXCL9) to 15.3% (high CXCL9). The inter-assay CV for all 37 tested samples averaged 10.3%.
Clinical accuracy study
To evaluate the clinical performances of uCXCL9 and uCXCL10 quantified by Ella®, over 1000 samples belonging to previously published cohorts21,25 were quantified again using the Ella® method. Clinical and biological characteristics of the patients are provided in Supplementary Table 2. We observed a high degree of correlation between uCXCL9 and uCXCL10 measurements by Ella® and by the reference ELISA method (P < 0.0001, Fig. 3c). More specifically, assessments from the two methods were compared using Bland-Altman test (Fig. 3d). For uCXCL10, both methods provided very superimposable values, with uCXCL10 Ella®/ELISA ratio mostly distributed around 1 (Bias = 1.08; 95%CI − 1.61:3.76). For uCXCL9, though highly correlated, numerical values were found higher when quantified by Ella® in comparison to ELISA (Bias = 2.58; 95%CI − 4.04:9.19). Combined with the previous recovery study using recombinant CXCL9, these results suggest that Ella® might provide a more accurate numerical quantification for CXCL9, than ELISA did. Finally, we previously established a model of AR risk using urine chemokines and their confounding factors. Using the same development cohort, we trained the model on Ella®-generated data, instead of ELISA data. Overall, discrimination performance of the 8-parameter model for the diagnostic of AR remained equivalent (AUCElla® = 0.8406, AUCELISA = 0.8481, DeLong’s P-value = 0.49, Fig. 3e). According to Youden’s method, the model cut-off for diagnosing acute rejection is 0.168. At this threshold, sensitivity is 88%, specificity is 68% and above all, negative predictive value is 95%.
The web application: assessment of acute rejection risk using urine chemokines
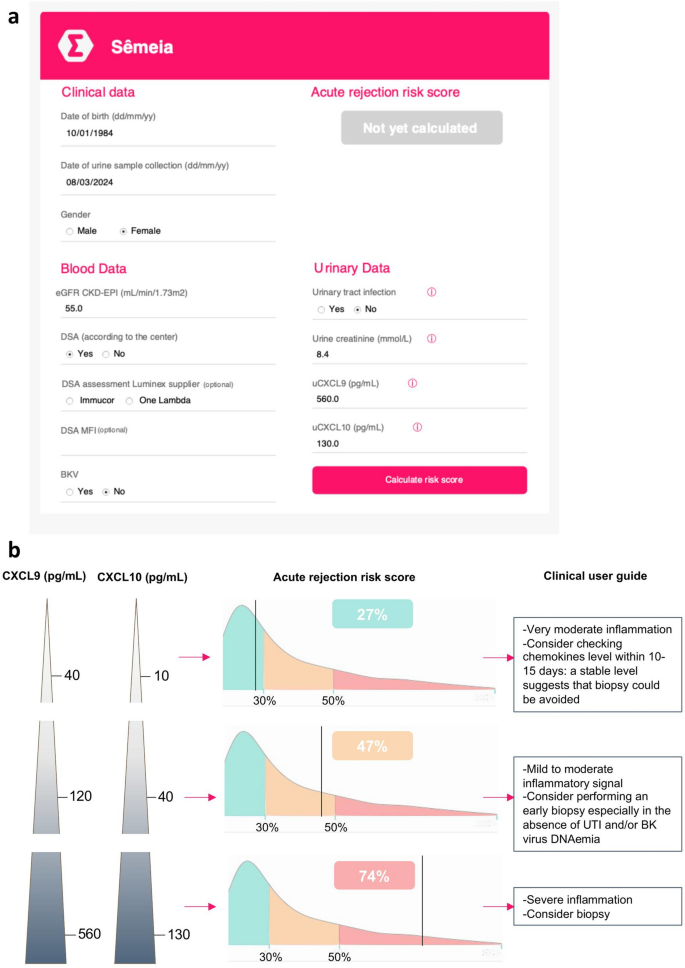
Our original model was derived in KTRs from Necker Hospital, and validated in an external single-center cohort and in a prospective multicenter unselected cohort21. All samples from these cohorts have since been quantified again by Ella® method, as well as all samples from our princeps study on urinary chemokines25, enabling to train and validate the model on a large set of Ella® data. The resulting model reached an AUC of 0.84 for any rejection diagnosis (Fig. 3e). For clinical assessment of a patient’s risk for AR, and either prompt the decision in performing a biopsy, either argue for avoiding a unnecessary biopsy, we have built an open access web application calculator (BiOptim, Sêmeia, https://wise-master.admin.semeia.io/bioptim_computation). Transplant specialists may easily enter the kidney transplant recipient date of birth and date of urine sample collection and select the recipient gender (Fig. 4a). Then users fill in blood biological data, including the eGFR, the previous identification of DSA and the presence or absence of BKV viremia. Additionally, but not mandatorily, users may provide details concerning the DSA Luminex supplier, the MFI of immuno-dominant DSA or the BK viral load. Finally, users may enter the urine biological data by selecting the presence or absence of a urinary tract infection (symptomatic or asymptomatic, low or upper tract infection), and by filling the urine creatinine, uCXCL9 and uCXCL10 values. Of note, an order of the expected values of uCXCL9 and 10 in these various conditions is shown in Supplementary Fig. 2 as a guide for clinicians. For ease of use, lab test results may be entered in various units with build-in conversion calculation. A screen shot of the results interface is shown in Fig. 4b, computing an individualized risk of rejection according to the 8-parameter model including Ella®-measured urine chemokines. Using the clinical and blood biological data of the simulated patient in Fig. 4a, three distinct urine chemokine patterns were run in the application and their respective acute rejection risk score is depicted, illustrating the additive value of uCXCL9 and uCXCL10 in a DSA positive KTR. The user guide for clinicians then suggests how to interpret the calculated risk score, with the decision to perform a biopsy nevertheless left to the transplant specialist’s expertise. Health Care Professionals may register their unit preference for future use as well as a create a patient’s profile, allowing time intervals between score to be graphically displayed and listed. Finally, for flexibility missing data can be imputed by last recorded data (e.g. no recent DSA assessment but patient was always DSA negative), or by mean imputation (e.g. missing BKV viral load imputed by mean viral load).


Building of a web application for clinicians. An open access web application was developed to prompt the use of urine chemokines in daily practice (https://wise-master.admin.semeia.io/bioptim_computation). (a) The web application offers a simple interactive interface. Users may now easily enter their patients’ clinical data (age, gender), serum lab tests (creatinine, DSA and BKV viral load) and urine lab tests (creatinine, uCXCL9 and uCXCL10 levels), and rapidly run the risk score. Example for a 40-year old woman, with a urine chemokine assessment performed in March 2024. She presents with a 55 mL/min eGFR, has a history of DSA but no current blood BK virus replication or UTI. (b) A screen shot of the results interface is shown, computing an individualized risk of rejection according to the 8-parameter model including Ella®-measured urine chemokines. Using the same clinical and blood biological data as in Panel a, 3 distinct urine chemokine patterns were run in the application and their respective acute rejection risk score is depicted, illustrating the additive value of uCXCL9 and uCXCL10 in a DSA positive KTR.

